Updated on November 26, 2025
With over 30% of Australian roofs covered in solar panels, you might be feeling a little left out without a system. After all, your neighbours are saving money by producing, storing, and consuming homegrown electrons from solar.
At PSC Energy, we understand the value of solar energy. It can save you a fair amount of money and it’s good for the planet. We’re sympathetic to the upfront cost of a solar system.
But it costs more to buy energy from the grid. And we’re about to show you why.
In this article, you will learn:
- The Cost of Staying with an Energy Retailer
- The Cost of Installing Solar Panels
- How Much Money Solar Panels Save
- When Staying with the Grid Might Make Sense
- FAQ: Cost of Solar and the Grid
By the end of this article, you’ll have a complete understanding of how much solar will cost upfront versus purchasing energy from the grid.
The Cost of Staying with an Energy Retailer
We mentioned that 30% of Australian rooftops have solar. The other 70% are purchasing all their energy from retailers. We hate this. Why? Because they’re paying full price for something that could be discounted through solar. It’s bad for the planet too.
Let’s look at the cost of importing energy from the grid.
What is the Grid?
The grid is a collection of poles, wires, and substations that provide communities with electricity. They do so by burning fossil fuels at power stations and distributing the generated electricity to homes in their service network.
“DNSP” stands for Distribution Network Service Provider. A DNSP is the company responsible for operating, maintaining, and managing the distribution network – the poles, wires, and substations – that deliver electricity to homes and businesses.
In Australia, DNSPs differ by state or region, and customers typically don’t interact directly with them for billing, because customers pay energy retailers instead. However, DNSPs are critical in ensuring a stable power supply, handling outages, and managing the physical infrastructure that supports electricity delivery.
DNSPs charge energy retailers. These charges cover the costs of maintaining and operating the network that delivers power to homes and businesses. Retailers then include these costs in the bills they send to customers.
These costs are network charges or connection and maintenance costs that get back to the consumer via their energy bill.
Cost of Energy from an Energy Retailer
Energy retailers in Australia (and in many other countries) have different electricity prices based on when you use electricity. These are known as peak, off-peak, and shoulder charges. Here’s how each period works and what they mean for your electricity costs:
1. Peak Charges
- Definition: Peak hours are when electricity demand is highest. During these hours, more people are using electricity at the same time, leading to greater demand on the grid.
- Cost: Peak charges are the highest because it costs more to generate and supply power during high-demand times. Peak rates are applied to hours when electricity use typically spikes on weekday evenings.
- Example Times: Usually from around 4 p.m. to 9 p.m. on weekdays (times may vary slightly based on the provider and location).
2. Off-Peak Charges
- Definition: Off-peak hours are when electricity demand is at its lowest. Fewer people use electricity during these times.
- Cost: Off-peak charges are the lowest, making this the most affordable time to use high-energy appliances, such as dishwashers, washing machines, or electric vehicle chargers. Your hot water system is usually scheduled to heat up during off-peak hours.
- Example Times: Usually late at night and early in the morning, like 10 p.m. to 7 a.m. These hours can vary depending on the region and retailer.
3. Shoulder Charges
- Definition: Shoulder hours fall between peak and off-peak times. During shoulder periods, electricity demand is moderate.
- Cost: Shoulder rates are typically mid-range, less expensive than peak rates but more costly than off-peak rates.
- Example Times: Generally, shoulder hours occur in the morning/early afternoon, or on weekends.
The average charge for all three classifications is around $0.38 per kilowatt hour (kWh) in Western Sydney.
The supply charge – the amount a retailer charges you to connect to the grid – is around $1.00 per day. For a year, it costs around $365 to connect to the grid.
The average amount of kWh a home with a family of four uses is around 25kWh. The math to figure out the cost of energy per day is pretty simple:
$0.38 X 25kWh = $9.50 in a day X 365 days = $3,467.50 in a year
Don’t forget about the grid connection fees: $3,467.50 in a year + $365 = $3,832.50
Now that’s only if you use that much energy. Some households will use more while others will use less.
The warranted lifespan of solar panels is thirty years. Multiply the cost of energy for a year by thirty and you’ll have an idea of how much money you might be saving.
We can do that for you though: $114,975.
How long do you think energy will stay at the average cost of $0.38? It will only go up.
If you’re interested in learning a bit more about the differences between energy retailers and distributors, you might want to check out the following article titled, Energy Distributors vs. Energy Retailers: What’s the Difference?
The Cost of Installing Solar Panels
It doesn’t take much investigating to discover a wide price range for solar panels. Some are extremely cheap while others cost top-of-the-line prices.
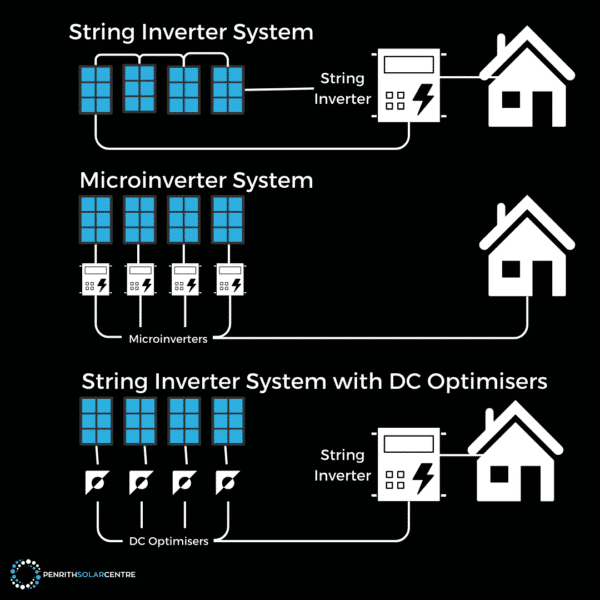
There are generally three types of solar systems available in Australia: microinverter systems, string inverter systems, and string inverter systems with DC optimisers.
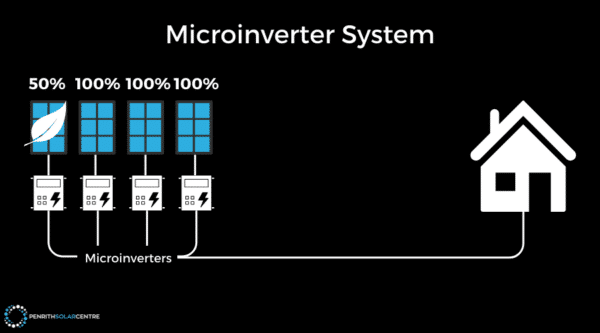
1. Microinverter Systems – Around $1.00 – 1.80 per watt.
- Definition: Microinverters are small inverters mounted beneath individual solar panels. Instead of having a single, central inverter, each panel has its own inverter to convert DC power to AC power at the panel level.
- Advantages: Microinverter systems are highly efficient, especially in cases where some panels might be shaded or oriented differently. Because each panel operates independently, shading or dirt on one panel won’t affect the performance of the others.
- Ideal For: Homes with complex roofs, shading issues, or multiple orientations. Microinverters also offer more flexibility for adding panels in the future, as each panel operates independently.
2. String Inverter Systems – Around $0.50 – 1.00 per watt.
- Definition: A string inverter system uses a single, central inverter connected to multiple panels arranged in “strings.” DC electricity from the panels flows to the central inverter, where it’s converted to AC electricity for household use.
- Advantages: String inverters are generally more affordable than microinverters as there is only one central inverter. They work efficiently when all panels receive consistent sunlight.
- Ideal For: Homes with a simple roof layout where all panels can be placed on the same plane with minimal shading. String inverters are also suitable for homeowners looking for a cost-effective solution.

3. String Inverter Systems with DC Optimisers – Around $1.00 – 1.50.
- Definition: A string inverter system with DC optimisers combines a central string inverter with small optimisers attached to each panel. The DC optimisers adjust the output of each panel individually, which improves performance before sending the electricity to the central inverter.
- Advantages: These systems are string systems that perform like microinverters without some of the advantages of microinverters. They are more efficient than standard string systems in cases where some panels might experience shading or different orientations.
- Ideal For: Homes with minor shading or complex roof layouts, where certain panels may perform differently at different times.
Example Calculation
Now that you know the price of each system, we can move on to an example.
We’re going to estimate the cost of the system here and give you some figures to consider. The type of system we’re going to use will be an Enphase microinverter system. We sell them at around $1.30 per watt.
The system size we’re using to estimate is 11kW, which is an average size for us at PSC Energy. If you’re interested in the payback period for other types of solar systems, just do the following math with the prices listed above for a system size of your choosing.
Now we’re ready to do some math.
As we mentioned above, the average cost for energy per kWh is around $0.38.
Calculation Values:
- Daily Energy Consumption: Family uses 25kWh per day.
- Energy Costs: Cost per kWh is $0.38.
- Average Daily kWh produced by an 11kW system during the 3.9 peak sun hours Western Sydney receives (please note: peak sun hours are the total irradiation over 24 hours): 42.9kWh.
- How many kWh are consumed during daylight hours (out of the total 25kWh consumed over 24 hours)? It’s about 14kWh.
- Self-consumption savings: 14kWh (used from solar and not purchased) X $0.38 = $5.32 per day
- Income generated from a feed-in tariff (for kWh that you did not self-consume): 42.9kWh – 14kWh = 28.9kWh X $0.05 = $1.45 per day
- Total daily savings: $5.32 + $1.45 = $6.77
- Initial Cost of the System: 11kW Enphase system: ~$17,000
- Payback period:$17,000 / $6.77 = 2,511 days / 365 = 6.8 years
Here are a few things to keep in mind about the above math:
- The cost of energy will rise over time. Energy retailers hiked prices twice last year. Do you trust them to stop doing that? We don’t.
- With a solar battery, you’ll be able to store some of that 42.9kWh and use it in the evening, essentially eliminating energy bills from your retailer. However, it’s important to remember this will increase your payback period due to the cost of the battery. There are also those pesky connection fees that never go away.
- Please note: in the above figures, we used a very conservative consumption rate of 25kWh.
If you’re interested in learning a bit more about different types of solar systems from a cost point of view, you might want to check out the following article titled, Cost of Microinverters vs. Cost of String Systems.
Ready to go solar? Click here.
When Staying with the Grid Might Make Sense
While solar power offers many benefits, there are some situations where staying on the grid could be more practical or cost-effective. Here are a few cases where the grid might be a better option.
1. Renters and Short-Term Residents
If you’re renting or planning to move in the next few years, installing a solar system doesn’t make sense. The upfront cost is high, and the break-even point typically takes around 4 to 6 years. In most cases, renters can’t modify the property without the landlord’s permission, and even if they could, they might need to move before the system pays for itself. It’s a nice thing to do for your landlord, though.
2. Low Energy Users
For households with low energy needs – like single-person households – the potential for savings is lower. Since solar power systems are more effective for high-energy users, those with consistently low monthly bills usually don’t see the same financial return.
3. Limited Roof Space or Shading Issues
Solar panels require roof space and sunlight to generate power. If your roof is small, heavily shaded by trees or nearby buildings, or oriented away from the sun, a solar system won’t perform as efficiently as it could. Shading can significantly reduce power output, making it harder to rely on solar energy alone.
4. Financial Constraints for Upfront Costs
For some households, the upfront cost of installing solar—typically around $10,000 to $20,000 after rebates – is simply unaffordable, even with financing options. If paying upfront or obtaining financing is not possible, staying on the grid may be the only viable option. While solar may save money over time, the initial cost can be a barrier for some families.
If you’re interested in learning a bit more about solar payback periods, you might want to check out the following article titled, What is the Payback Period for Solar Panels in Australia?
Making the Right Decision for Your Home
Choosing between solar power and the grid comes down to your unique energy needs, budget, and long-term goals.
- Calculate Your Household’s Energy Usage
- Consider Your Budget for Upfront Costs
- Evaluate How Long You Plan to Stay in Your Home
- Assess Your Roof’s Suitability for Solar
At PSC Energy, we understand how overwhelming those first steps on your solar journey can be. Fortunately, we’re here to step in and help with articles like this one. It’s what we do. Please feel free to explore our Learning Centre for more information about solar systems.

If you’re interested in learning a bit more about solar panels and energy systems, you might want to check out the following article titled, Are Solar Panels Worth It in NSW, Australia? A Price Breakdown for 2025.
FAQ: Cost of Solar and the Grid
How does the cost of solar panels compare to the cost of grid electricity?
Solar panels cost more upfront, but grid electricity costs much more over time. An average family using about 25 kWh per day at roughly $0.38 per kWh in Western Sydney pays around $3,832.50 a year including supply charges. Over 30 years, that adds up to more than $114,000, and power prices are likely to rise. A well sized solar system can wipe out a large chunk of that long term spend.
How much does grid electricity cost the average home each year?
For a family using about 25 kWh per day at an average of $0.38 per kWh, the usage cost is about $3,467.50 a year. You then add roughly $365 a year in supply charges to stay connected to the grid. That brings the total to about $3,832.50 per year before any future price rises. Heavier users will pay more and lighter users will pay less.
What are peak, off peak, and shoulder electricity charges?
Energy retailers use time of use pricing with three main periods.
- Peak: Late afternoon and evening on weekdays when demand is highest. This is the most expensive power.
- Off peak: Late night and early morning when demand is low. This is the cheapest power and often used for hot water and EV charging.
- Shoulder: The times between peak and off peak with mid range prices.
The mix of these charges averages out to about $0.38 per kWh in Western Sydney in the example.
What is the electricity grid and what does a DNSP do?
The grid is the network of poles, wires, transformers, and substations that carries electricity from power stations to homes and businesses. Distribution Network Service Providers, or DNSPs, own and maintain this network in different regions. They charge energy retailers for using the poles and wires, and retailers pass those network costs on to you in your bill. You pay the retailer, but the DNSP keeps the wires working.
How much could I spend on grid power over 30 years without solar?
Using the example numbers, an average family spends about $3,832.50 a year on electricity and supply charges. Over 30 years, that totals roughly $114,975 if prices stayed flat. In reality, prices tend to rise over time, so the real cost is likely higher. Solar panels can cut a large share of this spend by replacing grid energy with rooftop energy.
What types of solar systems are available and how much do they cost per watt?
The article outlines three main system types and price bands per watt.
- Microinverter systems: About $1.00 to $1.80 per watt.
- String inverter systems: About $0.50 to $1.00 per watt.
- String systems with DC optimisers: About $1.00 to $1.50 per watt.
Microinverters cost more but handle shade better and give panel level control. String systems are cheaper and suit simple, sunny roofs. DC optimiser systems sit in the middle.
What are microinverter solar systems and who are they best for?
Microinverters sit under each panel and convert DC to AC at the panel level. Each panel works independently, so shade, dirt, or mismatch on one panel does not drag down the rest. Microinverters are ideal for complex roofs, multiple orientations, or any shading. They also make future expansion easier because you can add panels one by one.
What are string inverter systems and when do they make sense?
String systems use one central inverter connected to a chain of panels. All panels in a string feed DC power into that inverter, which converts it to AC for the home. This setup is cheaper because there is only one inverter. It works best when all panels share the same orientation and get even sun without much shade. It suits simple roofs and budget focused installs.
What are string inverter systems with DC optimisers?
String systems with DC optimisers add a small device to each panel. The optimiser manages the panel output before sending power down the string to the central inverter. This improves performance when some panels see shade or sit at different angles. These systems sit between standard string and microinverter setups in both cost and performance and suit roofs with mild shading or mixed layouts.
How much solar energy can an 11 kW system produce and how does that affect savings?
In Western Sydney, an 11 kW system is estimated to produce about 42.9 kWh per day based on 3.9 peak sun hours. If the household uses 25 kWh per day with about 14 kWh during daylight, that 14 kWh can come straight from solar. The remaining solar can go to a feed in tariff. This mix of self-consumption and exports drives daily savings.
How do rising energy prices affect solar payback?
Rising grid prices increase the value of every kilowatt hour your solar system produces. The example uses $0.38 per kWh, but many retailers have lifted prices more than once in recent years. If rates rise, your savings per kWh rise too. That usually shortens the real payback period compared to a flat price model.
How does adding a battery change the savings and payback?
A battery lets you store part of the 42.9 kWh that the system produces and use it at night instead of buying grid power. This can reduce energy usage charges close to zero, leaving mostly the daily supply fee. However, batteries add cost, so the payback period for a solar plus battery system is longer than for solar alone. The trade off is deeper bill reductions and better backup during outages.
When might staying with the grid make more sense than installing solar?
Staying on grid only can make sense in a few situations.
- You rent or plan to move soon and will not stay long enough for payback.
- You use very little energy and your bills are already low.
- Your roof is small, shaded, or poorly oriented for solar.
- You cannot afford the upfront cost or finance for a system.
In these cases, solar may not deliver a strong financial return, even though it still has environmental benefits.
Who benefits most from switching from grid only to solar?
High usage households that own their home and plan to stay for several years benefit the most. They pay a lot for grid power now and can offset much of that with solar. Homes with suitable roof space and good sun exposure get better output. People who can invest upfront or access finance comfortably are in the best position to capture long term savings.
What factors should I weigh when choosing between solar and the grid?
You should look at a few key points before you decide.
- Your current and expected energy usage.
- Your budget and access to finance for upfront costs.
- How long you plan to stay in the home.
- Your roof size, condition, and shading.
When those pieces line up, solar often beats the long term cost of buying everything from the grid. A detailed quote and usage analysis from a trusted installer can help you see the numbers clearly for your situation.